Investors got more excited about international investing late last year. Some of that was chasing better returns, as developed international equities solidly beat the U.S. over the last three months of 2022. Some of that was the increased popularity of value investing as mega-cap U.S. technology stocks became less in favor. The surprising resilience of core European economies and a weaker U.S. dollar added to the market’s excitement. After such strong performance in international benchmarks recently, is there enough good news still yet to come for these markets to continue to outpace the U.S.?
International Earnings Outlook Is Improving
Earnings are, of course, the bottom line, so when looking at an equity investment we certainly can’t ignore earnings. The U.S. has been the clear earnings leader relative to international for the past decade, but the tide has recently turned. International earnings slightly outgrew U.S. earnings in 2022, (7.7% vs. 5.4% based on the latest estimates) and we believe international earnings may hold up slightly better in 2023 than the U.S.—it may be a 1-0 game, (a pitcher’s duel for you baseball fans) but the U.S. is no longer the place to go for earnings growth.
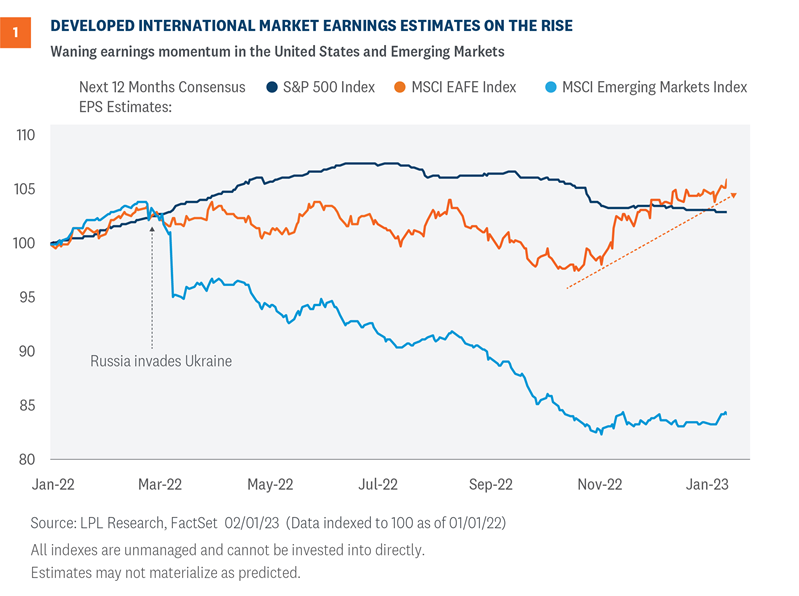
As shown in Figure 1, international earnings have also been exhibiting better momentum recently. Estimates have risen steadily over the past three months, while earnings estimates in the U.S. have edged lower and are likely to come down further. A weaker U.S. dollar translating into more non-U.S. earnings is a big part of the story, but there are other factors at work here. More on that below.
Emerging market (EM) earnings tumbled early in 2022 after Russia’s invasion of Ukraine and the subsequent removal of Russian companies from the index, and have stalled since. EM companies have had a difficult time translating economic growth into profits over the past decade for a number of reasons, largely China-related, a situation that does not appear likely to change in 2023.

International Valuations Remain Attractive
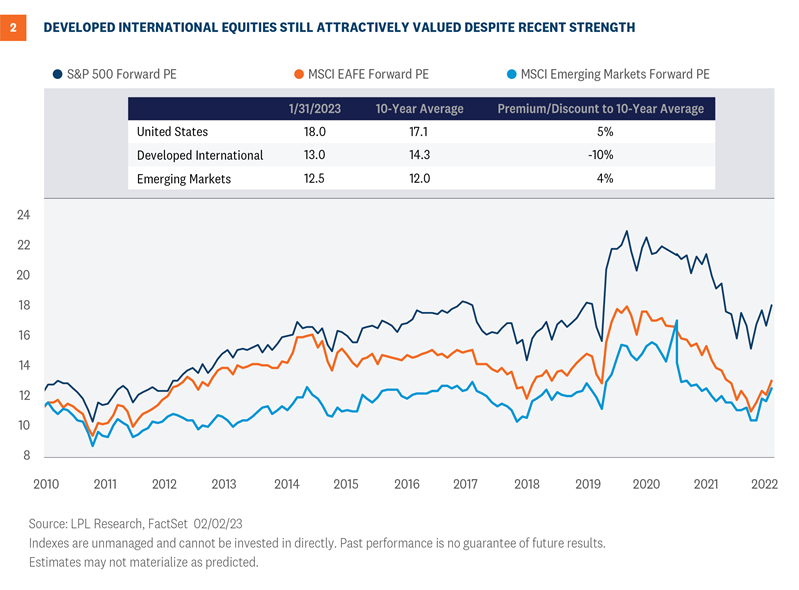
Turning to valuations, that slightly better (perhaps “less weak”) near-term earnings outlook does not come at a steeper price. International stock valuations have been lower than those in the U.S. for much of the past three decades. Despite recent outperformance, the gap between price-to-earnings ratios for the MSCI EAFE Index and the S&P 500 Index is still quite large (Figure 2). Developed international stocks are trading at a 28% discount to the S&P 500 on a forward price-to-earnings (PE) basis. That discount is the largest in at least 30 years, and larger than the average discount over the past 10 years of 16%. The valuation discount for international has grown so large that it is actually in line with EM.

Absolute valuations relative to history also make international valuations look attractive. The current forward P/E of 13 for the MSCI EAFE is 10% below its 10-year average, while the U.S. and EM are 0.9 points and 0.5 points above average by the same measure.
Even if we adjust international for its different sector mix, it’s only 8% more expensive (so still a 20% discount to the U.S. on an apples-to-apples basis). After many headfakes since the 2008-2009 global financial crisis, where short rallies in international evaporated and the long-term downtrend in relative performance resumed, this time could potentially be more sustainable.
Resilient European Economies
Europe’s surprising resilience has undoubtedly been part of the improving international story. European markets have demonstrated solid resilience despite mounting concerns over the ongoing Russia/Ukraine conflict, natural gas supplies, interest rates climbing higher as the European Central Bank (ECB) continues to raise rates, and a slow start to China’s reopening.
Recent official Eurostat data releases suggest the Eurozone expanded by 0.1% in the fourth quarter of 2022 compared with the third quarter. Moreover, the most recent Purchasing Managers’ Index, which includes both manufacturing and services, indicated a modest expansion for the first time in six months. In addition, the International Monetary Fund (IMF) upgraded its 2023 economic forecast for the Eurozone to 0.7%, from an initial projection of 0.5% made in October.
Natural gas prices, which had climbed higher at the onset of the military conflict, turned considerably lower as supplies were restored and moderate weather helped restrain demand. Also bolstering economic and market expectations is China’s reopening, which is expected to restore China’s historically strong trade relationships with Eurozone nations, particularly Germany, France, and Italy.
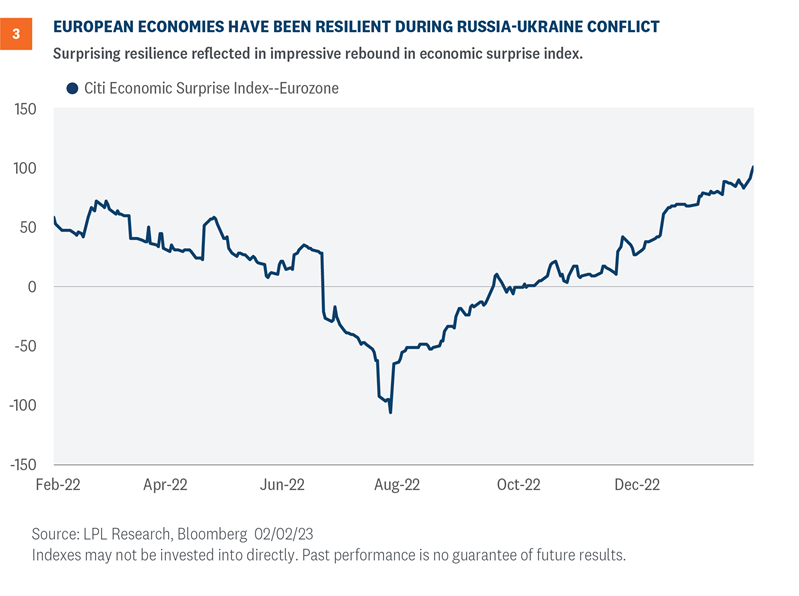
Although concerns remain that the very modest recovery could edge lower, the widely followed ZEW index that serves as a barometer for German investor sentiment moved into positive territory in February, reflecting a marked shift in expectations. The index had remained negative since before the onset of the Russia/Ukraine conflict. Christine Lagarde, president of the ECB, commented in late January that “the news has become much more positive in the last few weeks.” That can be seen in the Eurozone economic surprise index, shown in Figure 3.

We don’t know how long this better news will last, and downsize risks clearly remain, but international investors seem to be using a glimmer of sun to make some hay.
U.S. Dollar Shifting from Headwind to Tailwind
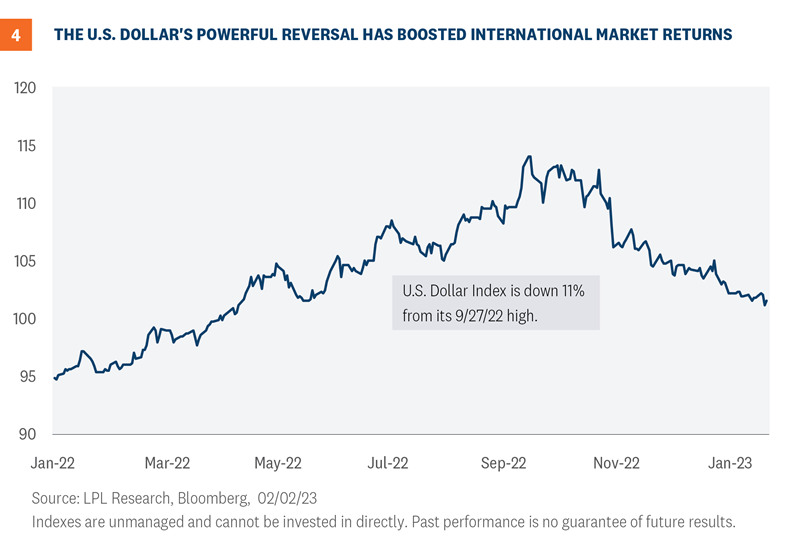
During 2022, as the Federal Reserve (Fed) launched its aggressive interest rate hiking campaign, the U.S. dollar began a near-parabolic climb above developed market currencies (Figure 4). S&P 500 multinational companies felt the sting of the escalating dollar, and in earnings reports the strong dollar was mentioned as a significant headwind as their foreign earnings were reduced as they were converted into dollars. Approximately 40% of S&P 500 earnings originate in non-U.S. markets.

As it became apparent the Fed was planning to move towards smaller hikes, the dollar began to ease considerably in the fall of 2022. Also, whenever Fed Chair Jerome Powell mentioned there was a possibility for a soft economic landing, the dollar softened even more.
In early 2023, the dollar transitioned from being a headwind to a tailwind that could help underpin multinational earnings and U.S. investor returns in non-U.S. investments. Companies with a strong input from foreign earnings are seeing more interest from investors than companies that are more domestically focused. The currency translation to dollars is now helping earnings rather than hurting them.
Currency movements are notoriously hard to forecast, but we believe the odds favor a lower rather than higher dollar over the balance of this year.
Conclusion
As we weigh the pros and cons of international equities relative to the U.S., the ledger is looking more balanced. Earnings are soft everywhere, but maybe international delivers slightly better earnings growth in 2023. International equities are cheap, but they’ve been cheap for a while and adjusting for sector exposures (much less high valuation technology/digital media/eCommerce exposure than the U.S.), valuations aren’t as compelling.
The weight of the evidence, based on technical analysis, may point to international, but the last couple of weeks show us why we may not want to count the U.S. out. Especially with economic risks in Europe high in the intermediate term and no guarantee of further U.S. dollar weakness.
So while the international outlook is improved, we also believe investors should hold at least benchmark level exposure to U.S. equities, if not slightly more, at the expense of fixed income. The U.S. is where the innovation is, which won’t stop because of still-elevated inflation or fears of recession. And the end of the Fed rate hiking campaign is approaching as inflation comes down, despite Friday’s strong jobs number.
Jeffrey Buchbinder, CFA, Chief Equity Strategist, LPL Financial
Quincy Krosby, PhD, Chief Global Strategist, LPL Financial
IMPORTANT DISCLOSURES
This material is for general information only and is not intended to provide specific advice or recommendations for any individual. There is no assurance that the views or strategies discussed are suitable for all investors or will yield positive outcomes. Investing involves risks including possible loss of principal. Any economic forecasts set forth may not develop as predicted and are subject to change.
References to markets, asset classes, and sectors are generally regarding the corresponding market index. Indexes are unmanaged statistical composites and cannot be invested into directly. Index performance is not indicative of the performance of any investment and do not reflect fees, expenses, or sales charges. All performance referenced is historical and is no guarantee of future results.
Any company names noted herein are for educational purposes only and not an indication of trading intent or a solicitation of their products or services. LPL Financial doesn’t provide research on individual equities.
All information is believed to be from reliable sources; however, LPL Financial makes no representation as to its completeness or accuracy.
All investing involves risk, including possible loss of principal.
US Treasuries may be considered “safe haven” investments but do carry some degree of risk including interest rate, credit, and market risk. Bonds are subject to market and interest rate risk if sold prior to maturity. Bond values will decline as interest rates rise and bonds are subject to availability and change in price.
The Standard & Poor’s 500 Index (S&P500) is a capitalization-weighted index of 500 stocks designed to measure performance of the broad domestic economy through changes in the aggregate market value of 500 stocks representing all major industries.
The PE ratio (price-to-earnings ratio) is a measure of the price paid for a share relative to the annual net income or profit earned by the firm per share. It is a financial ratio used for valuation: a higher PE ratio means that investors are paying more for each unit of net income, so the stock is more expensive compared to one with lower PE ratio.
Earnings per share (EPS) is the portion of a company’s profit allocated to each outstanding share of common stock. EPS serves as an indicator of a company’s profitability. Earnings per share is generally considered to be the single most important variable in determining a share’s price. It is also a major component used to calculate the price-to-earnings valuation ratio.
All index data from Bloomberg.
For a list of descriptions of the indexes and economic terms referenced in this publication, please visit our website at lplresearch.com/definitions.
This research material has been prepared by LPL Financial LLC.
Securities and advisory services offered through LPL Financial (LPL), a registered investment advisor and broker-dealer (member FINRA/SIPC). Insurance products are offered through LPL or its licensed affiliates. To the extent you are receiving investment advice from a separately registered independent investment advisor that is not an LPL affiliate, please note LPL makes no representation with respect to such entity.
| Not Insured by FDIC/NCUA or Any Other Government Agency | Not Bank/Credit Union Guaranteed | Not Bank/Credit Union Deposits or Obligations | May Lose Value |
